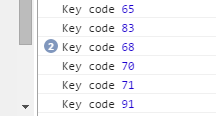
When debugging javascript applications you sometimes need to place comments in places to see the flow of the application. Using breakpoints is useful but if there are a lot of individual steps, console logging can be a better way to visualise the execution.
One of the problems with sticking console.log around the code is that you need to go back and tidy them up at a later date. You can of course use something like stripify to remove them but that leaves your dev environment full of unnecessary logging.
A better way to deal with this problem is to place adhoc console logs in the chrome debugging tools.
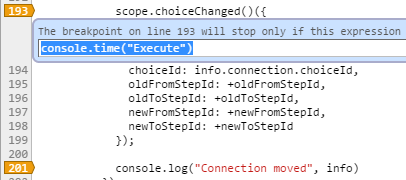
To do this you can use conditional breakpoints with console.log as the condition. console.log returns undefined which is falsey, so your breakpoints won’t ever fire, but they are still evaluated.

The great thing about the conditional break points is that they allow you to access everything in scope at the time of execution.

You can even console.time for quick profiling, useful when testing the performance of parts inside a third party library.


Also if you are mental you can use alert() too.